Time Series Jiří Holčík
Chapter 8: Basic types of discrete-time systems
8.1 Elementary computational units in realisation block diagrams for discrete-time systems
Linear discrete-time systems can be realised by means of three elementary computational
units:
- proportional unit, i.e. multiplication by a constant;
- delay unit;
- summation unit or difference unit.
Example:
Determine the realisation block diagram which is described by the following difference equation:
or, in concise form:
Solution:
Let us rearrange this equation to obtain the form
and then

The corresponding realisation block diagram is shown in Figure 8.1.

Figure 8.1 Block diagram corresponding to the difference equation (8.1).
8.1.1 Proportional unit
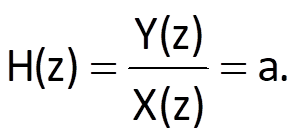
In this case the shape of the output waveform is proportional to its input and the ratio of all values of the output and input sequence is constant and equal to the “gain” a. That means that the defining equation is in the form
The transfer function is then given by a formula
8.1.2 Delay unit

Figure 8.2 Block diagram of a discrete delay unit
In discrete-time systems described by difference equations (Figure 8.2), the delay unit is the most important elementary computational units.
It is described by the difference equation
Based on the formula for Z-transform of a time-shifted causal sequence, the defining difference equation is
and consequently, the formula for the transfer function is

The frequency transfer function can be obtained by substituting z = eiΩTs for H(z) into Eq. (8.8). Therefore, we obtain
and for the normalised sampling frequency, we get
8.1.3 Basic structures of discrete-time systems
Form of the transfer function is thought of as the basic criterion to distinguish the basic structures of discrete-time systems. According to this criterion, discrete-time systems are classified as:
- moving average (MA) systems, with their transfer function in the form

where Q(z) is a polynomial of a complex variable z; the transfer function implies that the difference equation of such systems is
- autoregressive (AR) systems, with their transfer function in the form
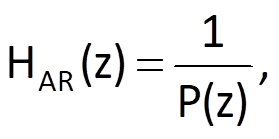
where P(z) is again a polynomial of a complex variable z;
- autoregressive moving-average (ARMA) systems with a transfer function in the most general form is defined as

According to the Wold’s theorem, systems meeting the requirements for the specific properties can be theoretically realised by means of any of the above-mentioned types of system structures. It is just a question of the system’s complexity – or order. The Wold’s decomposition theorem implies that:
- any ARMA or MA process can be unambiguously represented by an AR system (model) of any order, including infinity;
- any ARMA or AR process can be unambiguously represented by a MA system (model) of any order, including infinity.
8.2 Moving average systems
8.2.1 Summation unit of the first order with constant coefficients

Figure 8.3 Block diagram of the summation unit of the first order with an initial condition at the delay unit
The summation unit of the first order with constant coefficients is the basic system with moving average. Its defining difference equation is
and the corresponding realisation block diagram is shown in Figure 8.3. Its transfer function has the form
and its magnitude frequency response in a normalised frequency band <0, 1> with respect to one half of sampling frequency is shown in Figure 8.4a. The response depicted in the figure shows that a system defined in this way does not have a unit gain at the zero frequency. If we want to achieve this, we must respect the requirement for the computation of mean, i.e. each term in the sum must be multiplied by the weight corresponding to reciprocal of the number of samples in the sum. In our case, this means that the difference equation must be as follows:
and the transfer function will be

In that case, the magnitude frequency response will have the shape shown in Figure 8.4b. The summation unit accentuates low frequencies (a system with such frequency characteristics is called a low-pass filter) and the passband is relatively wide in systems of the first order. This frequency response can be also derived from the distribution of zeros and poles of the transfer function. The system has one pole at zero (no discrete-time system can be more stable) and one zero at z = –1 (which means that the magnitude frequency response is equal to zero at one half of sampling frequency).

Figure 8.4 Frequency responses of the summation unit of the first order with constant coefficients: (a) with a gain of 2; (b) with a gain of 1 at the zero frequency
The impulse response involves weights of individual addends; that is, the following will be used for a unit gain:
and the transient response, which is given by the sum of samples of the impulse response, will be
Due to symmetry of the impulse response, the phase frequency response is linear; the summation unit therefore does not produce a phase distortion in the sequence being processed. In this case, the magnitude of the samples of impulse response does not have any influence on the shape of phase frequency response.
8.2.2 Summation unit of th n-th order with constant coefficients
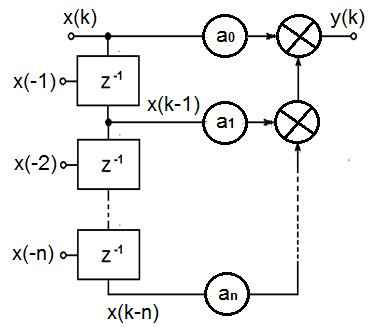
Figure 8.5 Realisation block diagram of a summation unit of the nth order
Extension of the summation window to n samples is represented by the following difference equation (and the block diagram shown in Figure 8.5)
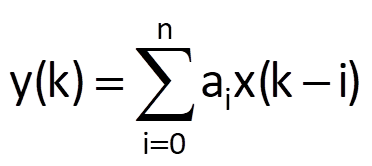
where weighting coefficients ai can generally take on any real value and subsequently determine the shape of the system’s frequency responses. In an elementary case, let us suppose that weights ai have the same magnitude. If unit gain of the system is to be retained, then ai = 1/n for all i.
The transfer function is

Frequency responses for n = 3 and for n = 6 are shown in Figure 8.6. Because the impulse response determined by the sequence of weighting coefficients has a rectangular shape (all samples of the impulse response have the same magnitude), the magnitude frequency response is given by the function sinx/x – but this function is deformed due to difference between frequency axes of continuous and discrete systems. Nevertheless, the following rule remains - the longer the summation window, the narrower the frequency passband at low frequencies and vice versa. The number of samples in the summation window also determines the number of zeros in the frequency response in the band <0, fs> (let us remind you that responses shown in figures in this chapter are normalised with respect to fs/2). The phase frequency response is linear again (the impulse response is symmetric about its centre) and discontinuities with 180° turns correspond to changes in polarity of the function sin(x)/x when it passes through zero.
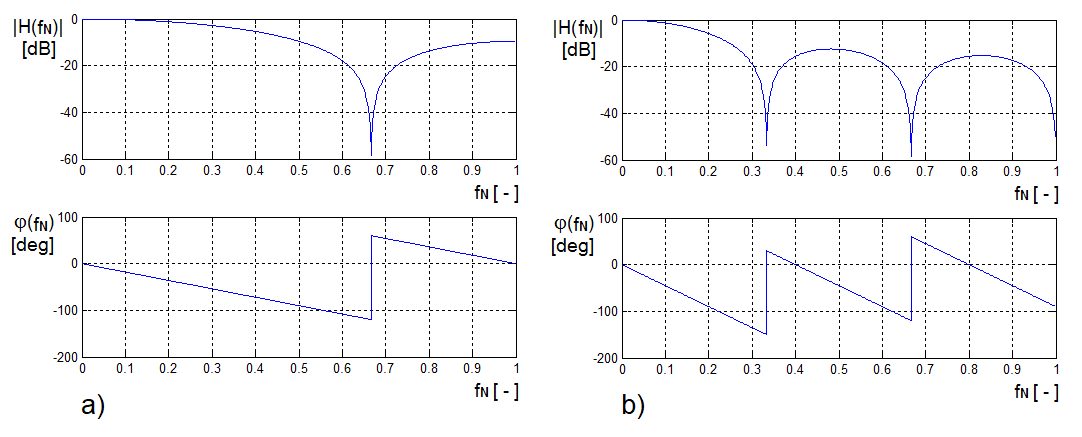
Figure 8.6 Frequency responses of summation units for (a) n = 3; (b) n = 6
8.2.3 Difference unit
A difference unit of the first order is a special case of a summation unit with weighting coefficients a0 = 1, a1 = –1; or, if unit gain at fs/2 is to be maintained, a0 = 0.5, a1 = –0.5. As a result, the difference equation is
For the case with unit gain, the transfer function of this discrete unit is

The frequency response of this system is shown in Figure 8.7a. The transfer function has one zero for z = 1, and therefore it is equal to zero at the zero frequency. Unlike the summation unit, the difference unit accentuates higher-frequency components of the input sequence; a system with such frequency characteristics is called a high-pass filter. The impulse response has non-zero samples h(k) = {0.5, –0.5}. It is therefore antisymmmetric about its centre and the phase frequency response is linear again. The transient response has samples g(k) = {0.5, 0, 0, …}, and therefore has the shape of a discrete impulse.
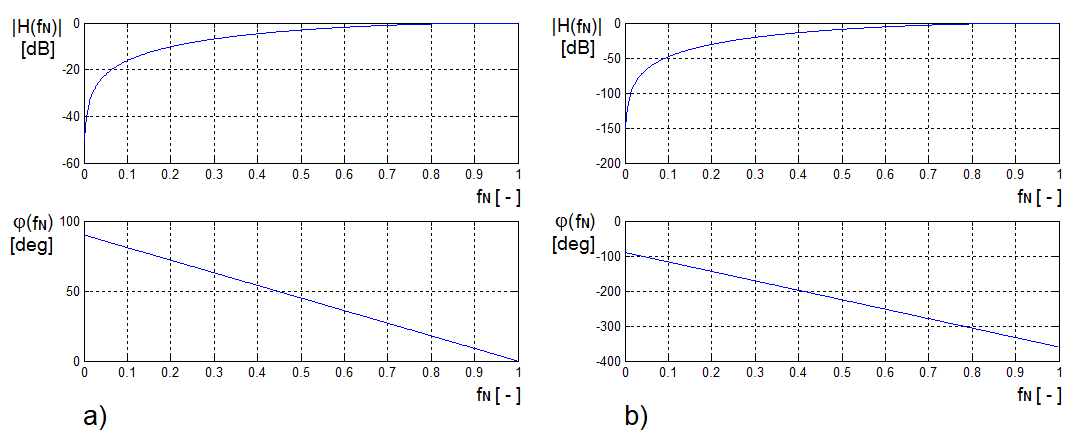
Figure 8.7 Frequency responses of difference units for (a) n = 1; (b) n = 3
Difference units of the nth order with unit gain are defined by the difference equation

and their transfer function is defined as

This means that the transfer function has an n-tuple zero for z = 1 and a monotonous growing tendency of magnitude frequency response is therefore retained in the band <0, fs/2>; however, this response is steeper (frequency response for n = 3 is shown in Figure 8.7b; the shape of magnitude frequency response seems to be the same as that for n = 1 in the same figure, but note that the scale of the y-axis is different).
8.3 Autoregressive systems
8.3.1 Autoregressive system of the first order
The character of an autoregressive system of the first order changes depending on the sign with which the delayed sample of output sequence enters the computation. Let us therefore consider two variants of the difference equation
or
(for a system with unit gain at a half of sampling frequency) and
or
Let us first examine the first case. The computational diagram of this system, corresponding to the difference equation
is depicted in Figure 8.8.
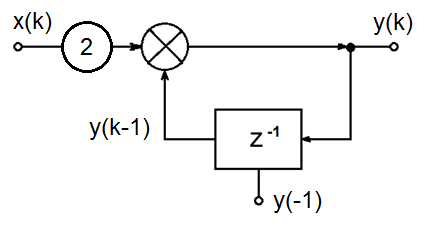
Figure 8.8 Realisation block diagram of an autoregressive system of the first order according to Eq. (8.29)
Its transfer function is given by

(compare with Eq. (6.17) for the Z-transform of accumulation). The transfer function has one zero for z = 0 (which is not that much important), but also one pole for z = 1 (which is more important). Because the pole is located on the unit circle, it means that the system is marginally stable. The location of the pole also means that the system has a resonance maximum at f = 0. Frequency responses corresponding to these conclusions are shown in Figure 8.9a. Due to the feedback, the impulse response is infinite (i.e, it has an infinite number of elements) and it can be determined as the response to a discrete unit impulse. The same applies for the transient response, too.
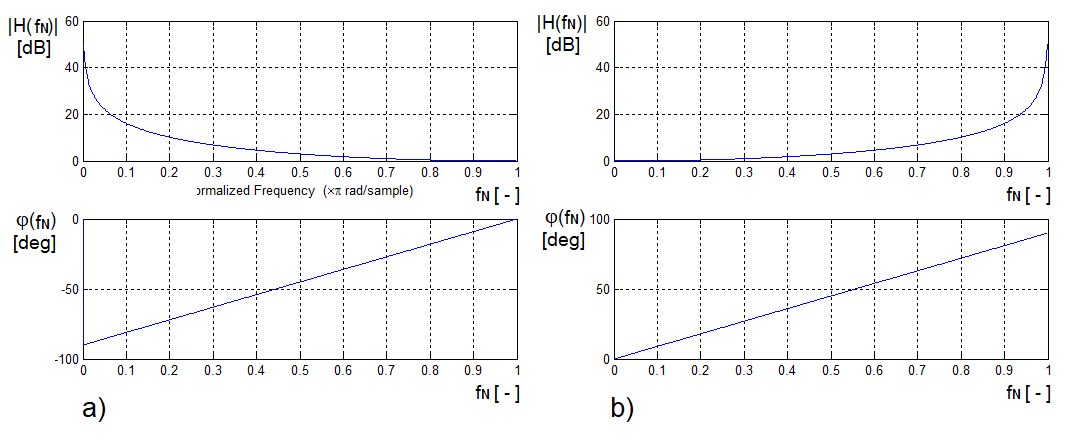
Figure 8.9 Frequency responses of an autoregressive system of the first order (a) according to Eq. (8.27a); (b) according to Eq. (8.28a)
Example:
Determine the impulse response and the transient response of an autoregressive system of the first order described by difference equations (8.27a) or (8.29).
Solution:
The impulse response is the system’s response to a discrete unit impulse δ(k) = {1, 0, 0, …} for k ≥ 0. The computation will be based on the difference equation (8.29), let us therefore suppose the initial condition y(–1) = 0. Then,
y(0) = 2x(0) + y(–1) = 2·1 + 0 = 2;
y(1) = 2x(1) + y(0) = 2·0 + 2 = 2;
y(2) = 2x(2) + y(1) = 2·0 + 2 = 2;
y(3) = 2x(3) + y(2) = 2·0 + 2 = 2;
…, etc.
This implies that h(k) = {2, 2, 2, 2, …}, k ≥ 0. According to the system’s magnitude frequency response (Figure 8.9a), the direct current component of the input sequence is dominantly preferred, which is reflected by the corresponding response to the unit impulse; this results into a sequence with samples of constant values.
The transient response is the system’s response to a unit-step sequence σ(k) = {1, 1, 1, 1, …} for k ≥ 0. Again, the computation is based on the difference equation (8.29) with the same initial condition y(–1) = 0. We therefore get
y(0) = 2x(0) + y(–1) = 2·1 + 0 = 2;
y(1) = 2x(1) + y(0) = 2·1 + 2 = 4;
y(2) = 2x(2) + y(1) = 2·1 + 4 = 6;
y(3) = 2x(3) + y(2) = 2·1 + 6 = 8;
…, etc.
The resulting sequence g(k) = {2, 4, 6, 8, …} grows linearly, as it is right and proper for cumulation, which is represented by the transfer function.
The transfer function of a system described by the difference equation (8.28a) is

and the corresponding difference equation has the form
The transfer function has one pole at the point z = –1. That means that the system is again marginally stable and that the magnitude frequency response has a resonance maximum at the frequency f = fs/2. Frequency responses corresponding to these conclusions are shown in Figure 8.9b.
As in the preceding example, the impulse response is infinite due to the feedback.
Example:
Determine the impulse response and the transient response of an autoregressive system of the first order described by difference equations (8.28a) or (8.32).
Solution:
We will determine the impulse response by means of difference equation (8.32). Again, let us suppose a zero initial condition y(–1) = 0. Then,
y(0) = 2x(0) – y(–1) = 2·1 – 0 = 2;
y(1) = 2x(1) – y(0) = 2·0 – 2 = –2;
y(2) = 2x(2) – y(1) = 2·0 – (–2) = 2;
y(3) = 2x(3) – y(2) = 2·0 – 2 = –2;
:
Analogously, we will get the following for the transient response:
y(0) = 2x(0) – y(–1) = 2·1 – 0 = 2;
y(1) = 2x(1) – y(0) = 2·1 – 2 = 0;
y(2) = 2x(2) – y(1) = 2·1 – 0 = 2;
y(3) = 2x(3) – y(2) = 2·1 – 2 = 0;
:
If the system is to prefer dominantly the frequency component with a frequency equal to one half of sampling frequency and if the system is marginally stable, it is logical that the impulse response is periodic with a two-sample period. The transient response has the same period. Moreover, its periodic component is added to the constant level, which is given by the character of the input sequence.
Linear continuous systems of the first order cannot oscillate – to do this, a pair of complex conjugate poles would be needed. This implies that a continuous oscillatory unit has to be of at least second order. The situation is somewhat different in the case of a discrete-time linear system, due to the delay caused by sampling. However, there is a limited selection of frequencies at which the autoregressive system of the first order can oscillate. In this case, it is only f = fs/2.
It is practically impossible to determine the centre of an infinitely long impulse response, based on which we could tell whether the impulse response is symmetric, antisymmetric or neither. Nevertheless, if we consider any sample of the computed infinite impulse response, which is located at infinity, the impulse response can be thought of as symmetric (although this is a very intuitive and simplified idea and we hope that mathematicians will not get too emotional about it). The phase frequency response is linear.
Now, let us try to set right the system’s marginal stability, which can cause troubles due to round-off errors during the computation of output sequence. If we want to increase the system’s stability, we must shift the pole of the transfer function towards the origin of the coordinate system. Let us therefore verify the behaviour of a system with the following transfer function, for example:

The transfer function has one pole at a real value z = –0,9, which means that the dominantly amplified frequency remains the same as in the case of the system described by equations (8.28a) or (8.31). However, if that pole is not located on the unit circle (i.e. frequency circle), then the magnitude frequency response does not tend to an infinite value at f = fs and the resonance maximum will decrease (to a specific finite value) and become wider. Frequency responses of this system are shown in Figure 8.10.
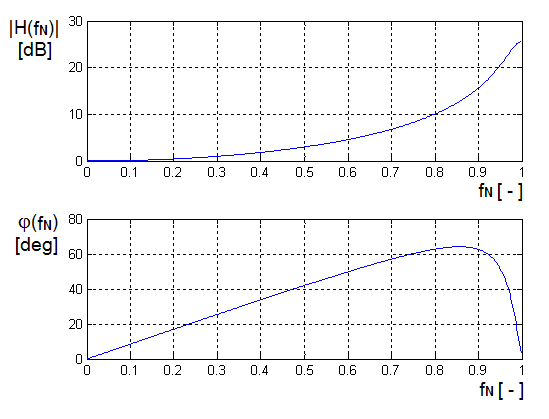 Figure 8.10 Frequency responses of an autoregressive system according to Eq. (6.113)
Example:
Determine the value of magnitude frequency response for f = fs/2 in a system with transfer function given by Eq. (8.33).
Solution:
Because the magnitude frequency response is given by the magnitude of the frequency transfer function for z on a unit circle, i.e. for substitution z = eiΩN
or z = eiΩTs for a specific sampling frequency or period. For a frequency corresponding to one half of the sampling frequency, we have z = –1. After substitution in the transfer function, we get

Because the magnitude frequency response is displayed in dB, let us determine how many decibels correspond to the proportional value HAR1+s(z) = 19. Such a value is computed from the formula
H(z)|dB = 20logHAR1+s(z) = 20log19 ≈ 25.9,
which is certainly the value that can be read from the response shown in Figure 8.10.
Example:
Determine the impulse response of an autoregressive system of the first order described by the difference equation (8.33).
Solution:
We will use the same procedure as in preceding examples of this chapter to compute the impulse response. We will use the difference equation derived from the transfer function according to (8.33), i.e.
y(k) = 1.9x(k) – 0.9y(k – 1)
and again, we will use the initial condition y(–1) = 0. We will then get the following calculations for the impulse response:
y(0) = 1.9·x(0) – 0.9·y(–1) = 1.9·1 – 0.9·0 = 1.9;
y(1) = 1.9·x(1) –0.9·y(0) = 1.9·0 – 0.9·1.9 = –1.71;
y(2) = 1.9·x(2) – 0.9·y(1) = 2·0 –0.9·(–1.71) = 1.539;
y(3) = 1.9·x(3) – 0.9·y(2) = 2·0 – 0.9·1.539 = –1.3851;
…, etc.
In this case, values of the impulse response are computed according to the formula h(k) = (– 1)k·1.9·0.9k for k ≥ 0. The impulse response therefore shows an attenuated oscillatory character. Attenuated oscillations can be explained by the position of the transfer function’s pole inside the unit circle; the shape of the spectrum is somewhat different, corresponding to the shape of frequency response; and its value at a half of sampling frequency is not infinite any more: values of transfer function are finite for all frequencies and correspondingly contribute to changing the spectrum of impulse response.
8.3.2 Autoregressive system of the second order
In general, an autoregressive system of the second order is defined by the difference equation
where parameters a0, b1 and b2 determine not only frequency characteristics of a given system. The coefficients cannot be arbitrary: they must be a combination of either a pair of real poles or a pair of complex conjugate poles of the transfer function. The following text will not look into ways of determining these parameters in order to get the required characteristics of the systems; we will only examine several typical cases. Our previous experience from the analysis of systems described in previous sections will be useful to make partial conclusions about the characteristics of further systems to be analysed.
Let us start with a system defined by the difference equation
i.e. an equation with parameters a0 = 2, b1 = 0 and b2 = 1. In this case, the transfer function is

The transfer function has a unit value for z = 1, i.e. for a zero frequency, as well as for z = –1, i.e. for f = fs. It has a pair of complex conjugate poles with zero real components which are located on the imaginary axis and, at the same time, on the unit circle in a position corresponding to one quarter of sampling frequency (Figure 8.11a). Therefore, the magnitude frequency response has a resonance maximum on a frequency equal to one quarter of sampling frequency (Figure 8.11b). A system that only transmits a certain frequency band is called a band-pass filter. The system is marginally stable, its impulse response is periodic and based on previous experience, it should have a foursample period.
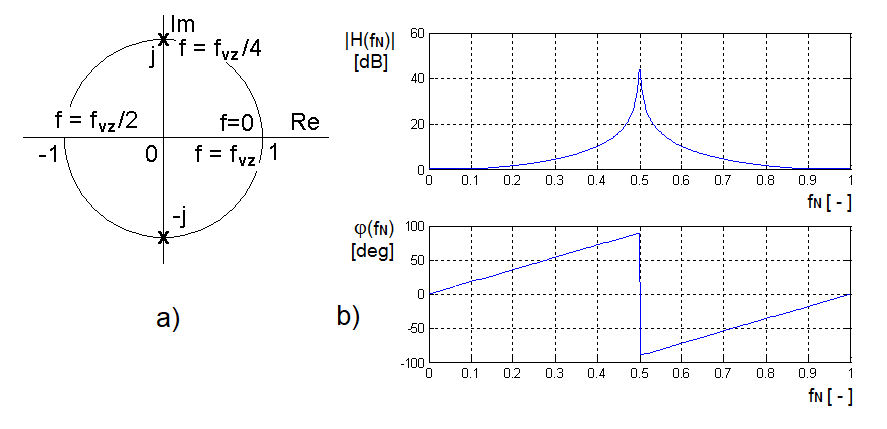
Figure 8.11 (a) Position of poles of the system according to Eq. (8.36) in a complex plane z; (b) the system’s frequency responses.
Example:
Determine the impulse response of an autoregressive system of the second order described by the difference equation (8.35).
Solution:
We will apply formerly verified procedure to determine the impulse response, using the difference equation
y(k) = 2·x(k) – y(k – 2),
and initial conditions y(–1) = y(–2) = 0.
For individual samples of impulse response, we get
y(0) = 2·x(0) – y(–2) = 2·1 – 0 = 2;
y(1) = 2·x(1) – y(–1) = 2·0 – 0 = 0;
y(2) = 2·x(2) – y(0) = 2·0 – 2 = –2;
y(3) = 2·x(3) – y(1) = 2·0 – 0 = 0;
y(4) = 2·x(4) – y(2) = 2·0 – (–2)= 2;
y(5) = 2·x(5) – y(3) = 2·0 – 0 = 0;
…, etc.
In this way we have verified that the impulse response of this system is periodic with a four-sample period.
Pause for thought:
How would the system’s characteristics change if the sign in the parameter b2 in the difference equation changed, leading to the following difference equation?
The procedure is always the same; an image showing frequency responses of a system defined in this way might possibly help (Figure 8.12).
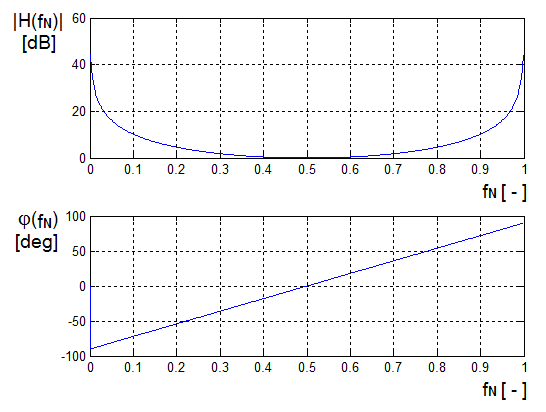
Figure 8.12 Frequency responses of an autoregressive system of the second order defined by the difference equation (8.37)
Another question might be: how would the behaviour change for an autoregressive system of the second order with parameters b1 = – √2, b2 = 1 and a0 = 2 + √2? The transfer function of this system has the form

It means that the argument of both poles is ±45°, corresponding to one eighth of the sampling frequency. The poles are located on the unit circle and the system is marginally stable. The impulse response is periodic, with an eight-sample period.
Furthermore, we can consider what would happen if poles shifted towards the centre of the unit circle in a system defined by Eqs. (8.35) or (8.36) or, by contrast, away from the centre (i.e. outside the unit circle), similarly to the previously examined system with a transfer function described by Eq. (8.33).
8.3.3 Autoregressive system of the n-th order
An autoregressive system of the n-th order is defined by the difference equation
or by the transfer function

If coefficients bi are of real values, the transfer function must have either real poles or complex conjugate poles. It means that any autoregressive system of a higher order can be created by a serial connection of autoregressive systems of the first order or the second order, the characteristics of which we can already identify. And we also already know how the serial connection of partial systems influences the characteristics of the resulting system.